Computational experiment - simulation of the operation of the technical system section "tank - reducer - heater (coil)"
			when heat power is supplied to a metal coil
|
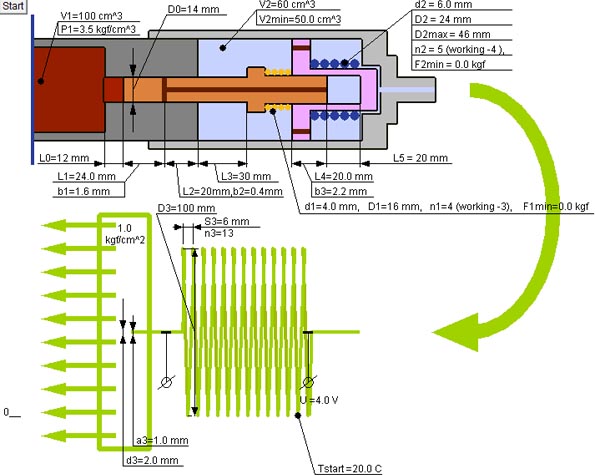
1. The scheme, color and dimensions of the elements of the scheme of the technical system change in the process of modeling work - a computational experiment (to start the process - the "START" button).
|
2. The initial data for the computational experiment are entered into the text fields located under the scheme.

|
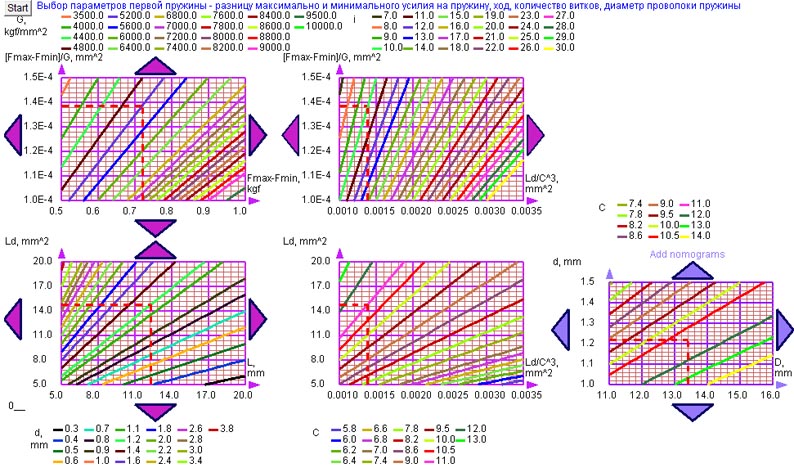
3. Part of the initial data was obtained using nomogram systems (with graphic-analytical calculation).
When you press the key combination (ALT + left mouse button) on one of the structural elements of the scheme (slotted gap, spring, coil, etc.), instead of the scheme,
a system of nomograms appears for selecting structural characteristics. The parameter values ??are selected by pressing the left mouse button at the desired point on the nomogram.
After selecting the design characteristics, we return to the scheme (key combination: SHIFT + left mouse button). Changing the dimensions of the design parameters should be reflected in the diagram.
Thus, using text fields, as well as using systems of nomograms (graph-analytical calculation), the initial state of the system was obtained before conducting a computational experiment.
|
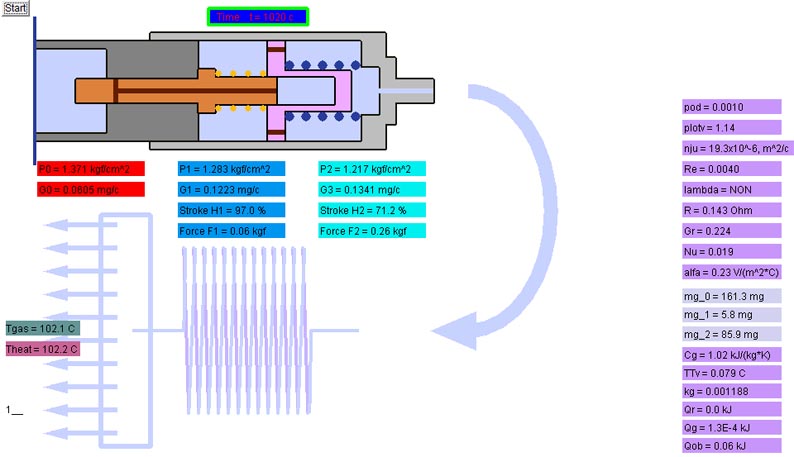
4. Let's start the computational experiment. We start the simulation of the process by pressing the "START" button.
We observe a change in the color of structural elements depending on changes in pressure and temperature, a change in the location of structural elements and their dimensions in the process of work.
Under the diagram of the technical system and to the right of the diagram, changes in the values of its parameters are recorded (in the process of modeling the system operation).
We evaluate the course of the computational experiment.
|
5. After completion of the computational experiment, we optimize the set of parameters using nomogram systems (in the next approximation).
We repeat the computational experiment.
Visualization of the choice of initial data using a graphical-analytical method of calculation and the subsequent conduct of a computational experiment is an effective method for developing a technical system
with an optimal combination of parameters.
|
|
|